> ## Documentation Index
> Fetch the complete documentation index at: https://www.ghostwriter.wiki/llms.txt
> Use this file to discover all available pages before exploring further.
# Health Monitoring
> How to monitor the health of Ghostwriter services
## Introducing Health Monitoring
Ghostwriter monitors the health of its services in two ways: Docker health checks and internal monitoring and testing.
### Docker Health Checks
Docker automatically monitors the containers via `HEALTHCHECK` commands (see [Docker documentation](https://docs.docker.com/engine/reference/builder/#healthcheck) for technical information). These commands check to make sure the service is responding and basic functionality is working.
The results of these commands can be checked with this command:
```log theme={"system"}
./ghostwriter-cli running
```
Each container runs a service-specific command on a schedule. If the command returns successfully (exit code `0`), the `Status` column will show `healthy`. Any other exit code will flip the status to `unhealthy`, indicating the service is likely not functioning properly.
By default, the commands run with these attributes that can be adjusted via Ghostwriter CLI's `config set` command:
* Start running after 30s (`HEALTHCHECK_START`, default is `30s`)
* Run every 120s (`HEALTHCHECK_INTERVAL`, default is `120s`)
* Timeout after 10s (`HEALTHCHECK_TIMEOUT`, default is `10s`)
* Will be retried once (`HEALTHCHECK_RETRIES`, default is `1`)
### Internal Testing and Monitoring
Ghostwriter also tests each service more thoroughly with two API endpoints:
* /status/
* /status/simple/
The first endpoint, */status*, tests critical services and displays a table of results:
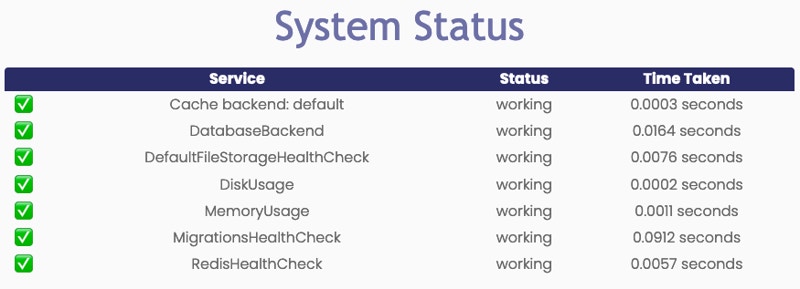 These tests are more thorough than the Docker health checks. For example, Docker will verify the database back end is listening and accepting connections, but Ghostwriter runs tests to ensure the database is accepting connections and reading and writing are working as expected.
This endpoint can also return a JSON version of the test results if you set the `Accept: application/json` header.
Running these tests constantly could be a strain on the server, so the tests run on-demand when you visit this page.
You can visit the simplified endpoint, */status/simple/*, to run lightweight checks. This endpoint checks the web server, database status, and cache status and returns one of the following responses:
| **Response** | **Response Code** | **Description** |
| ------------ | ----------------- | -------------------------------------------------------------------------------- |
| OK | 200 | System is healthy |
| WARNING | 200 | One or more tests did not pass and you should check the detailed status endpoint |
| ERROR | 500 | There was an unexpected error indicating a critical issue |
The home dashboard displays a basic system health status. The status is based on the results from the simplified endpoint.
### Configuration
The dashboard services map to the following configuration variables:
* DiskUsage: `HEALTHCHECK_DISK_USAGE_MAX` (Default is `90` \[percentage])
* MemoryUsage: `HEALTHCHECK_MEM_MIN` (Default is `100` \[in MB])
You can configure these values manually in the `.env` file or with Ghostwriter CLI (this sets and reads from `.env`). For changes in `.env` or using the CLI, bring containers `down` and `up`.
Example `.env` snippet with default values:
```sh theme={"system"}
HEALTHCHECK_DISK_USAGE_MAX='90'
HEALTHCHECK_MEM_MIN='100'
```
Example using the CLI to set and get the disk usage value:
```sh theme={"system"}
./ghostwriter-cli-linux config set HEALTHCHECK_DISK_USAGE_MAX 90
./ghostwriter-cli-linux config get HEALTHCHECK_DISK_USAGE_MAX
```
## Automated Monitoring
You can automate monitoring with something like Uptime Kuma or a similar tool. The recommended logic is:
* Request the */status/simple/* endpoint
* Check for the response code and content
* If `OK` is not in the response or the response code is not `200`, send an alert with a link to */status/* for details
If the tool is capable of triggering a secondary action, you could have the tool pull the JSON data from */status/*:
```log theme={"system"}
$ curl -k https://ghostwriter.local/status/ -H "Accept: application/json"
{"Cache backend: default": "working", "DatabaseBackend": "working", "DefaultFileStorageHealthCheck": "working", "DiskUsage": "working", "MemoryUsage": "working", "MigrationsHealthCheck": "working", "RedisHealthCheck": "working"}
```
Working services will have a `working` status. A service experiencing a problem will have a descriptive warning or error message that will tell you why it failed the test. You can use this information to customize your monitoring alert.
These tests are more thorough than the Docker health checks. For example, Docker will verify the database back end is listening and accepting connections, but Ghostwriter runs tests to ensure the database is accepting connections and reading and writing are working as expected.
This endpoint can also return a JSON version of the test results if you set the `Accept: application/json` header.
Running these tests constantly could be a strain on the server, so the tests run on-demand when you visit this page.
You can visit the simplified endpoint, */status/simple/*, to run lightweight checks. This endpoint checks the web server, database status, and cache status and returns one of the following responses:
| **Response** | **Response Code** | **Description** |
| ------------ | ----------------- | -------------------------------------------------------------------------------- |
| OK | 200 | System is healthy |
| WARNING | 200 | One or more tests did not pass and you should check the detailed status endpoint |
| ERROR | 500 | There was an unexpected error indicating a critical issue |
The home dashboard displays a basic system health status. The status is based on the results from the simplified endpoint.
### Configuration
The dashboard services map to the following configuration variables:
* DiskUsage: `HEALTHCHECK_DISK_USAGE_MAX` (Default is `90` \[percentage])
* MemoryUsage: `HEALTHCHECK_MEM_MIN` (Default is `100` \[in MB])
You can configure these values manually in the `.env` file or with Ghostwriter CLI (this sets and reads from `.env`). For changes in `.env` or using the CLI, bring containers `down` and `up`.
Example `.env` snippet with default values:
```sh theme={"system"}
HEALTHCHECK_DISK_USAGE_MAX='90'
HEALTHCHECK_MEM_MIN='100'
```
Example using the CLI to set and get the disk usage value:
```sh theme={"system"}
./ghostwriter-cli-linux config set HEALTHCHECK_DISK_USAGE_MAX 90
./ghostwriter-cli-linux config get HEALTHCHECK_DISK_USAGE_MAX
```
## Automated Monitoring
You can automate monitoring with something like Uptime Kuma or a similar tool. The recommended logic is:
* Request the */status/simple/* endpoint
* Check for the response code and content
* If `OK` is not in the response or the response code is not `200`, send an alert with a link to */status/* for details
If the tool is capable of triggering a secondary action, you could have the tool pull the JSON data from */status/*:
```log theme={"system"}
$ curl -k https://ghostwriter.local/status/ -H "Accept: application/json"
{"Cache backend: default": "working", "DatabaseBackend": "working", "DefaultFileStorageHealthCheck": "working", "DiskUsage": "working", "MemoryUsage": "working", "MigrationsHealthCheck": "working", "RedisHealthCheck": "working"}
```
Working services will have a `working` status. A service experiencing a problem will have a descriptive warning or error message that will tell you why it failed the test. You can use this information to customize your monitoring alert.